Ever have a few alerts on your database home page that you could really care less about? Are there ones that would be of some value if they just had a different threshold?
Adjusting the metrics and thresholds that come with the database is a pretty simple process that can add a lot of value or just eliminate some annoyances.
Navigation:
To get to the Metrics and Settings page, follow the steps below:
- Pull up your database home page.
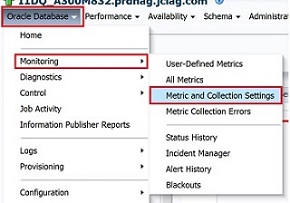
- Click on the "Oracle Database" menu in the top left side of the screen.
- Navigate to Monitoring and then to Metric and Collection Settings
- Choose either metrics that have thresholds, or all metrics.
Configuration:
To remove a metric from monitoring:
- Find the metric you want to stop monitoring (switch your view to metrics with thresholds to shorten the list).
- Delete any values in the warning and critical boxes (don’t set them to zero actually delete the values).
- If you want to remove monitoring for ALL of the metrics in a category you can turn off the collection schedule. Just click on the schedule and select disable.
To start monitoring a metric:
- Find the metric you want to monitor (switch your view to all metrics).
- Put the thresholds you want in the warning and/or critical.
- Make sure that the category your metric is in has a collection schedule.
- If the category your metric is in has its schedule turned off, you can click on the word “disabled” and go in and turn it on. WARNING: All of the metrics in that category will be turned on as well. If you don’t want all of them, make sure to delete the warning and critical thresholds.
To modify a metric:
- Find the metric you want to modify (switch your view to “all metrics”).
- If you want to change the warning or critical thresholds, you can just change the numbers there.
- If you want to change the collection schedule, that has to be done at the category level. WARNING: Changing the collection schedule will affect all of the metrics in that category.
Notes:
- The metrics are grouped into categories. Each category has a collection schedule associated with it. Turning off the collection schedule for the category turns off all of the metrics in that category.
- Metrics with multiple pencils can have different thresholds for different records returned as well as a default threshold. This is useful in metrics like tablespace free. You can set thresholds for some of the tablespaces returned and then the default for the rest.
- Metric thresholds have an option called Number of Occurrences. This is the number of times a collection has to run and a threshold breached before an alert is thrown. This works really well for things that spike and which you only care about an issue if it’s sustained.
If you are feeling adventurous, once you have the metrics set, you can try building a template and pushing that out to other databases. That way, you don’t have to repeat this process for every one of your databases.